
Information Technology Center
University of Peradeniya


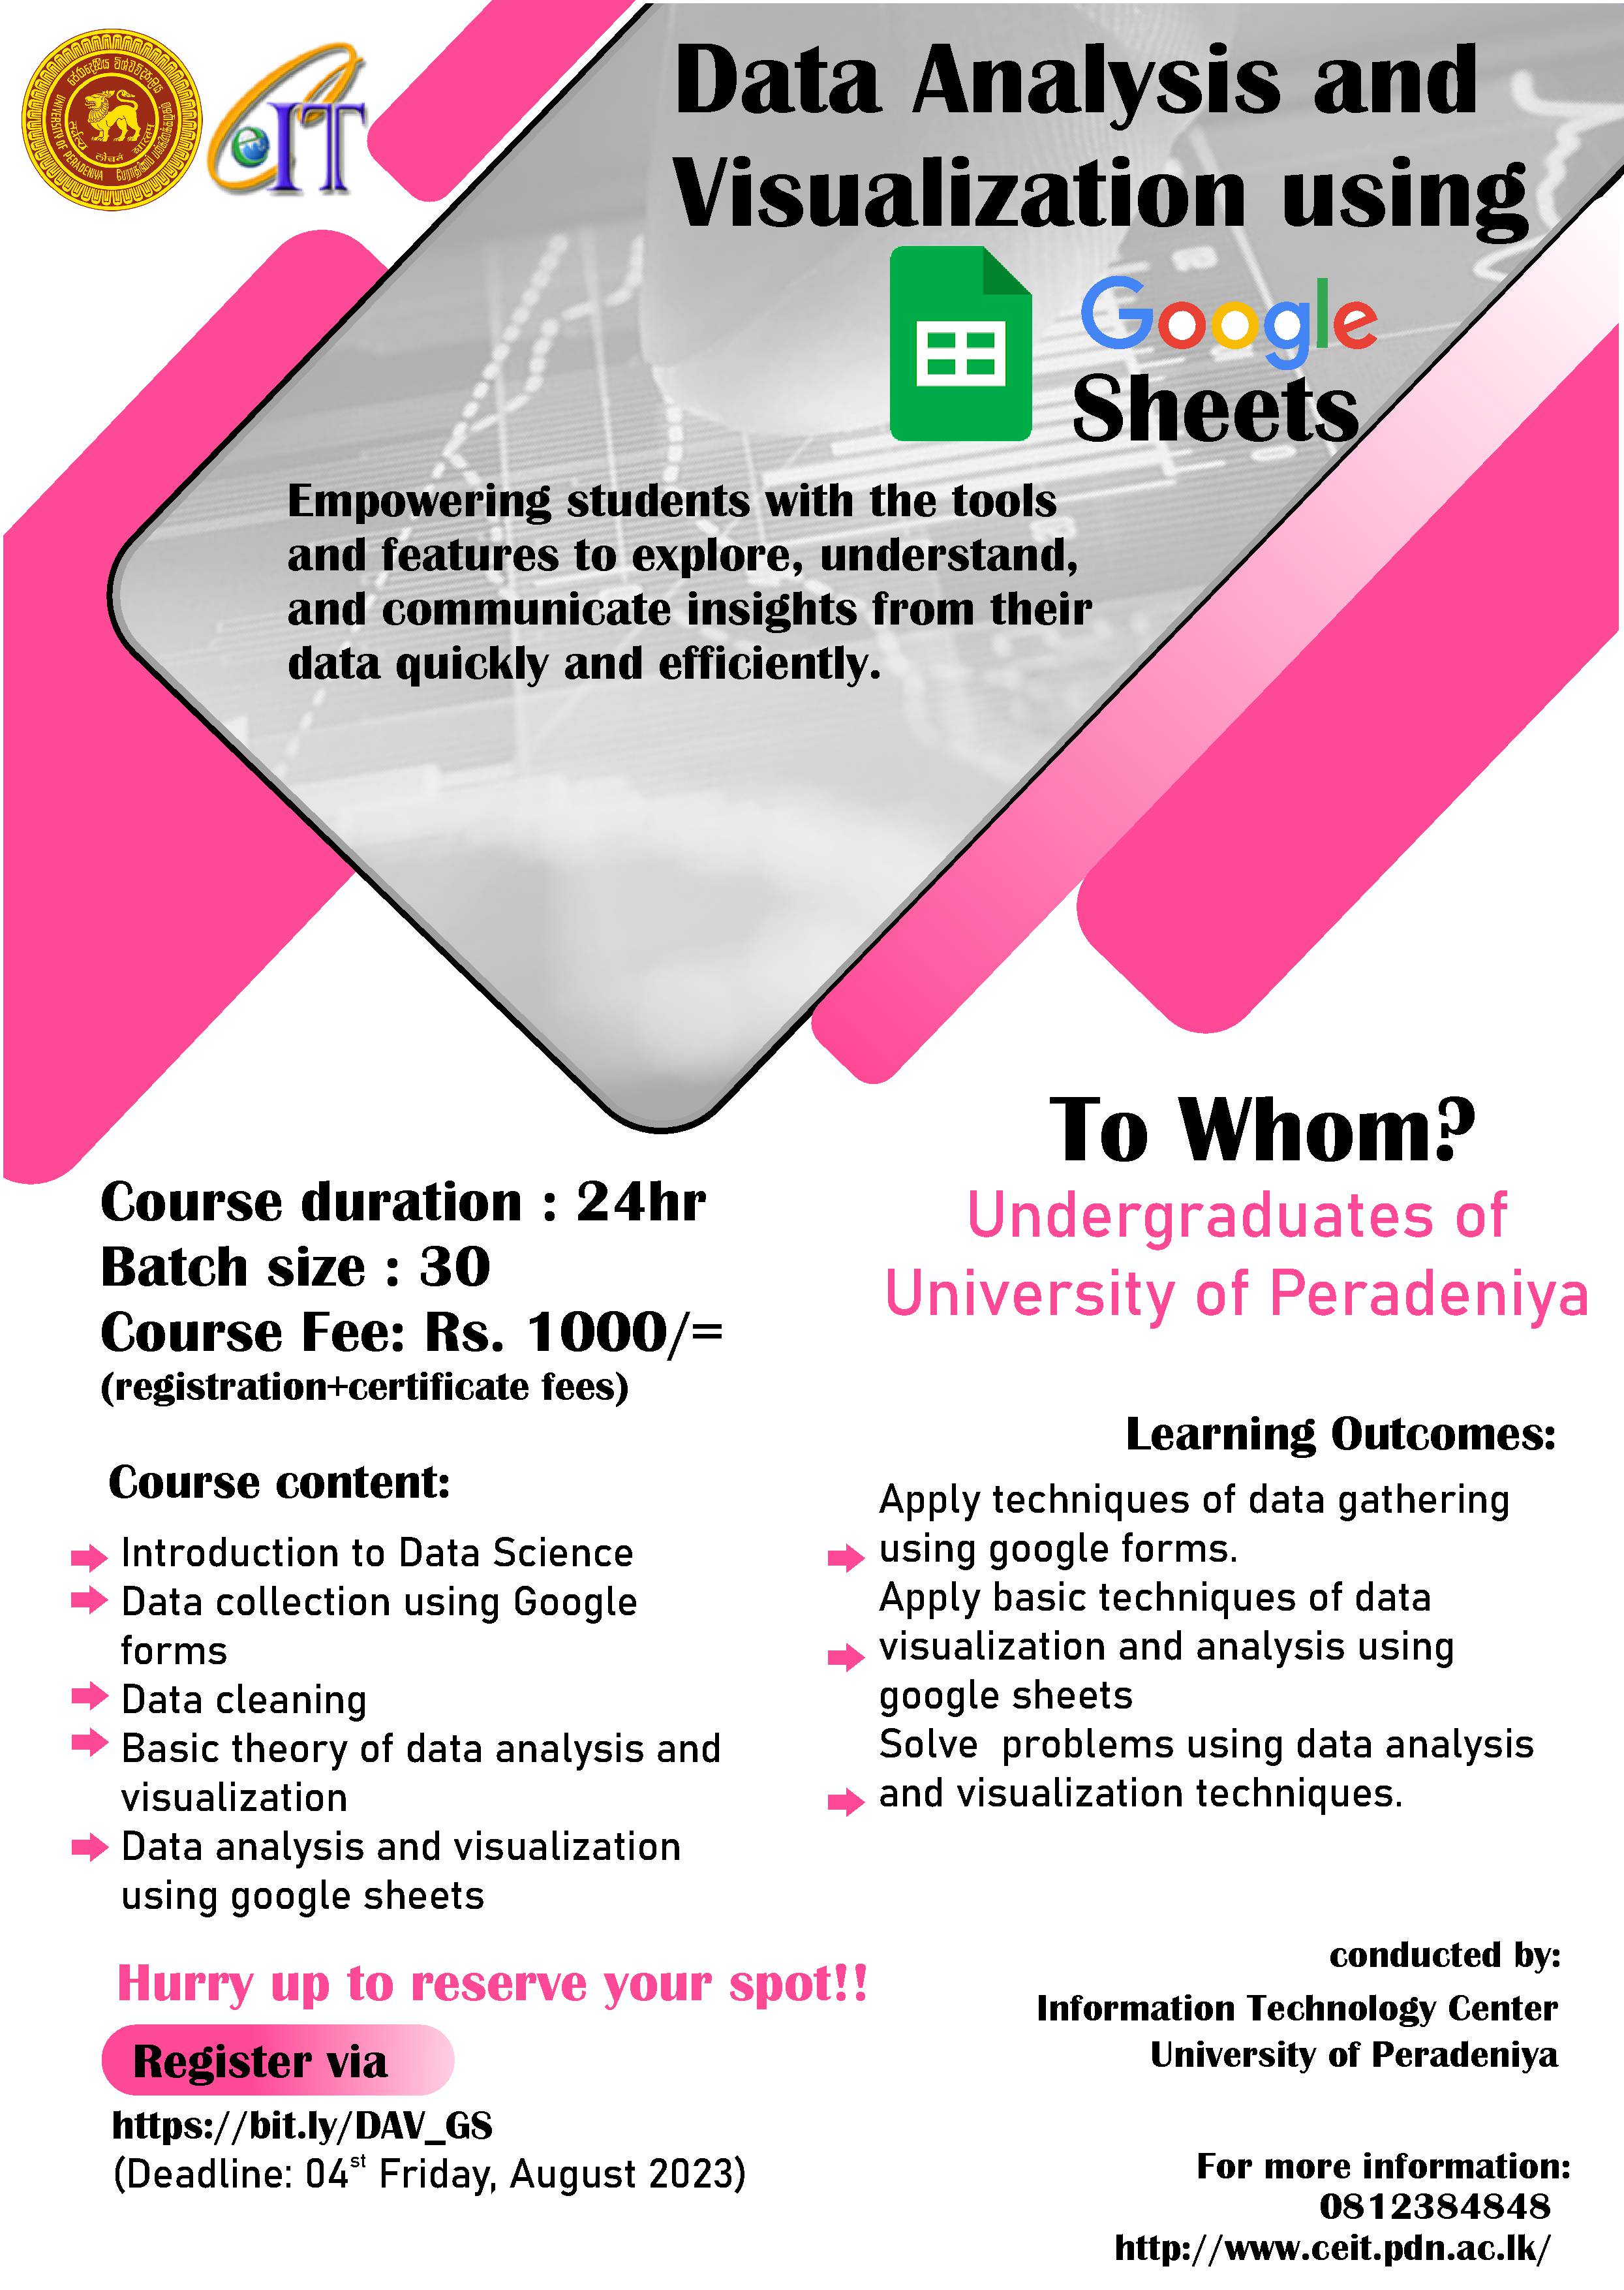
Data Analysis and Visualization using Google Sheets
Background
Data analysis skills are increasingly in demand. The ability to analyze and interpret data is becoming an essential skill in many industries. Employers in fields such as finance, marketing, and technology are looking for graduates with data analysis skills. Data visualization is the graphical representation of data. By visualizing data, it is easier to see patterns and trends, which can be difficult to discern from raw data. Analyzing data requires students to think critically and evaluate evidence. Visualization helps students to communicate their findings and make connections between data sets. Google Sheets is a powerful tool for data analysis and visualization that allows users to analyze large datasets. Google Sheets has some built-in quick analysis features that can help users with an overview of data and some useful insights. Google Sheets provides ease of transforming and analyzing data with its visualization tools and built-in functionalities. Google Sheets can also be useful to archive data long-term.
Target Audience
Undergarduate students of the University of Peradeniya
Regstration
Register via: https://bit.ly/DAV_GS
Fees
A registration fee of Rs. 1,000.00 will be charged from the registered students.
Delivery Mode of the Program
- Weekdays within 8.00-4.00
Evaluation
The evaluation will consist of 2 papers
- Mini Project and 2 hour Practical Examination